Nếu như các bạn đã tương sử dụng Visual Studio thì có lẽ bạn không thể bở qua tính năng Debug lỗi của nó, một chức năng cho phép chúng ta kiểm tra các giá trị của phần mềm trong quá tình PM hoạt động để dò tìm các lỗi của PM. Tin vui là trong Android Studio cũng đã tích hợp tính năng này cho chúng ta.
Android Studio includes a debugger that enables you to debug apps running on the Android Emulator or a connected Android device. With the Android Studio debugger, you can do the following:
- Select a device to debug your app on.
- Set breakpoints in your Java and C/C++ code.
- Examine variables and evaluate expressions at runtime.
- Capture screenshots and videos of your app.
Before you start debugging your app, make sure you’re using a build variant that sets the debuggable build type property to true, such as the “debug” build variant. To change the build variant Android Studio uses, select Build > Select Build Variant in the menu bar (or click Build Variants  in the windows bar), and then select a build variant from the drop-down menu. Similarly, if your app depends on a library module that you also want to debug, you need to configure the library module to publish a debuggable build variant, such as the “debug” variant. To learn more, read Publish non-default variants of your library.
To start debugging, click Debug  in the toolbar. Android Studio builds an APK, signs it with a debug key, installs it on your selected device, then runs it and opens the Debug window, as shown in figure 1. If you add C and C++ code to your project, Android Studio also runs the LLDB debugger in the Debug window to debug your native code.
If no devices appear in the Select Deployment Target window after you click Debug, then you need to either connect a device or click Create New Emulator to setup the Android Emulator.
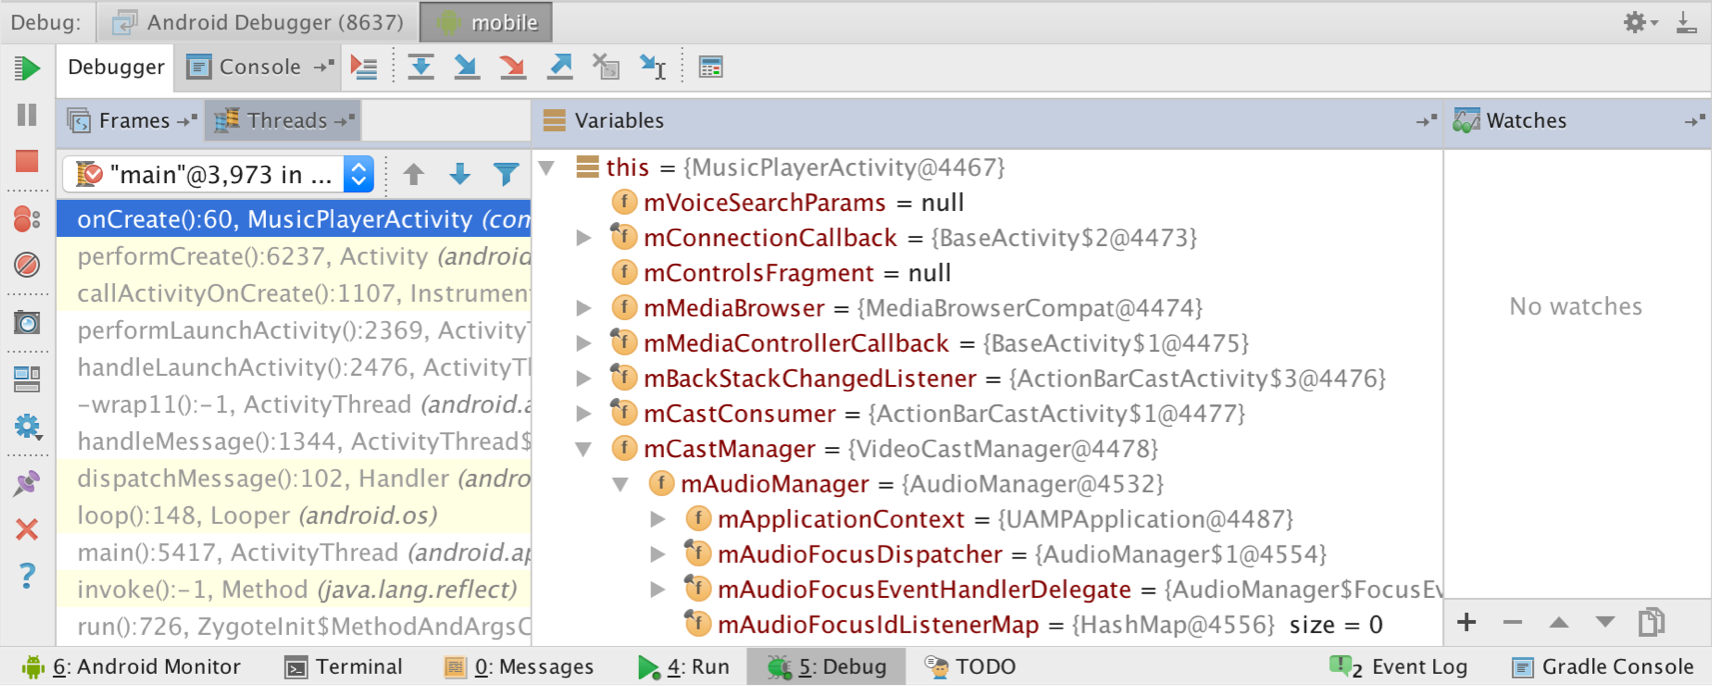
Figure 1. The Debugger window, showing the current thread and the object tree for a variable.
If your app is already running on a connected device or emulator, you can start debugging as follows:
- Click Attach debugger to Android process
 .
.
- In the Choose Process dialog, select the process you want to attach the debugger to.By default, the debugger shows the device and app process for the current project, as well as any connected hardware devices or virtual devices on your computer. Select Show all processes to show all processes on all devices; the display includes any services that your app created as well as system processes, for example.
From the Debugger menu, you can select a different debug type. By default, Android Studio uses the Auto debug type to select the best debugger option for you, based on whether your project includes Java or C/C++ code.
- Click OK.The Debug window appears. In this case, notice the two tabs to the right of the Debug window title: one tab is for debugging native code and the other for Java code, as indicated by -java.
 Separate debugging sessions have separate tabs and different port numbers, which are displayed in parentheses in the tab.
- To end a debugging session, click the tab for the session, and then click Terminate
 .
.
Note: The Android Studio debugger and garbage collector are loosely integrated. The Android virtual machine guarantees that any object the debugger is aware of is not garbage collected until after the debugger disconnects. This can result in a buildup of objects over time while the debugger is connected. For example, if the debugger sees a running thread, the associated Thread object is not garbage collected even after the thread terminates.
Debug types
By default, Android Studio uses the Auto debug type to decide which debugger(s) to use, so you don’t have to change configurations when switching between debugging Java and C/C++ code. However, you can create or edit a debug configuration to customize certain settings, such as adding symbol directories or LLDB commands, or use a different debug type. You can also select the debug type from the Debugger drop-down list in the Choose Process dialog when you attach the debugger to a running Android process.
The debug types available to you include the following:
- Auto
- Select if you want Android Studio to automatically choose the best option for the code you are debugging. For example, if you have any C or C++ code in your project, Android Studio automatically uses the Dual debug type. Otherwise, Android Studio uses the Java debug type.
- Java
- Select if you want to debug only code written in Java—the Java debugger ignores any breakpoints or watches you set in your native code.
- Native
- Select if you want to use only LLDB to debug your code. When using this debug type, the Java debugger session view is not available. By default, LLDB inspects only your native code and ignores breakpoints in your Java code. If you want to also debug your Java code, you should switch to either the Auto or Dual debug type.
- Dual
- Select if you want to switch between debugging both Java and native code. Android Studio attaches both the Java debugger and LLDB to your app process, one for the Java debugger and one for LLDB, so you can inspect breakpoints in both your Java and native code without restarting your app or changing your debug configuration.
Note: If you are debugging native code that is optimized by the compiler, you may get the following warning message: This function was compiled with optimizations enabled. Some debugger features may not be available. When using optimization flags, such as -O flags, the compiler makes changes to your compiled code to make it run more efficiently. This may cause the debugger to report unexpected or incorrect information because it’s difficult for the debugger to map the optimized compiled code back to the original source code. For this reason, you should disable compiler optimizations while debugging your native code.
Use the system log
The system log shows system messages while you debug your app. These messages include information from apps running on the device. If you want to use the system log to debug your app, make sure your code writes log messages and prints the stack trace for exceptions while your app is in the development phase.
Write log messages in your code
To write log messages in your code, use the Log class. Log messages help you understand the execution flow by collecting the system debug output while you interact with your app. Log messages can tell you what part of your application failed. For more information about logging, see Reading and Writing Logs.
The following example shows how you might add log messages to determine if previous state information is available when your activity starts:
import android.util.Log;
...
public class MyActivity extends Activity {
    private static final String TAG = MyActivity.class.getSimpleName();
    ...
    @Override
    public void onCreate(Bundle savedInstanceState) {
        if (savedInstanceState != null) {
            Log.d(TAG, "onCreate() Restoring previous state");
            /* restore state */
        } else {
            Log.d(TAG, "onCreate() No saved state available");
            /* initialize app */
        }
    }
}
During development, your code can also catch exceptions and write the stack trace to the system log:
void someOtherMethod() {
    try {
        ...
    } catch (SomeException e) {
        Log.d(TAG, "someOtherMethod()", e);
    }
}
Note: Remove debug log messages and stack trace print calls from your code when you are ready to publish your app. You could do this by setting a DEBUG flag and placing debug log messages inside conditional statements.
View the system log
Both the Android DDMS (Dalvik Debug Monitor Server) and the Android Monitor windows show logs from the system and any particular app process. To view the system log on the Android DDMS tool window:
- Start your app as described in Run your App in Debug Mode.
- Click Android Monitor
 .
.
- If the system log is empty in the Logcat view, click Restart
 .
.

Figure 2. The system log in the Android DDMS tool window.
The Android DDMS tool window gives you access to some DDMS features from Android Studio. For more information about DDMS, see Using DDMS.
The system log shows messages from Android services and other Android apps. To filter the log messages to view only the ones you are interested in, use the tools in the Android DDMS window:
- To show only log messages for a particular process, select the process in the Devices view and then click Only Show Logcat from Selected Process
 . If the Devices view is not available, click Restore Devices View
  on the right of the Android DDMS tool window. This button is only visible when you hide the Devices window.
- To filter log messages by log level, select a level from the Log Level drop-down on the top of the Android DDMS window.
- To show only log messages that contain a particular string, enter the string in the search box and press Enter.
Work with breakpoints
Android Studio supports several types of breakpoints that trigger different debugging actions. The most common type is a line breakpoint that pauses the execution of your app at a specified line of code. While paused, you can examine variables, evaluate expressions, then continue execution line by line to determine the causes of runtime errors.
To add a line breakpoint, proceed as follows:
- Locate the line of code where you want to pause execution, then either click the left gutter along that line of code or place the caret on the line and press Control+F8 (on Mac, Command+F8).
- If your app is already running, you don’t need to update it to add the breakpoint—just click Attach debugger to Android proccess . Otherwise, start debugging by clicking Debug .

Figure 3. A red dot appears next to the line when you set a breakpoint.
When your code execution reaches the breakpoint, Android Studio pauses execution of your app. You can then use the tools in the Debugger tab to identify the state of the app:
- To examine the object tree for a variable, expand it in the Variables view. If the Variables view is not visible, click Restore Variables View
 .
.
- To evaluate an expression at the current execution point, click Evaluate Expression
 .
.
- To advance to the next line in the code (without entering a method), click Step Over
 .
.
- To advance to the first line inside a method call, click Step Into
 .
.
- To advance to the next line outside the current method, click Step Out
 .
.
- To continue running the app normally, click Resume Program
 .
.
If your project uses any native code, by default, the Auto debug type attaches both the Java debugger and LLDB to your app as two separate processes, so you can switch between inspecting Java and C/C++ breakpoints without restarting your app or changing settings.
Note: For Android Studio to detect breakpoints in your C or C++ code, you need to use a debug type that supports LLDB, such as Auto, Native, or Dual. You can change the debug type Android Studio uses by editing your debug configuration. To learn more about the different debug types, read the section about using other debug types.
When Android Studio deploys your app to your target device, the Debug window opens with a tab, or debug session view, for each debugger process, as shown in figure 4.
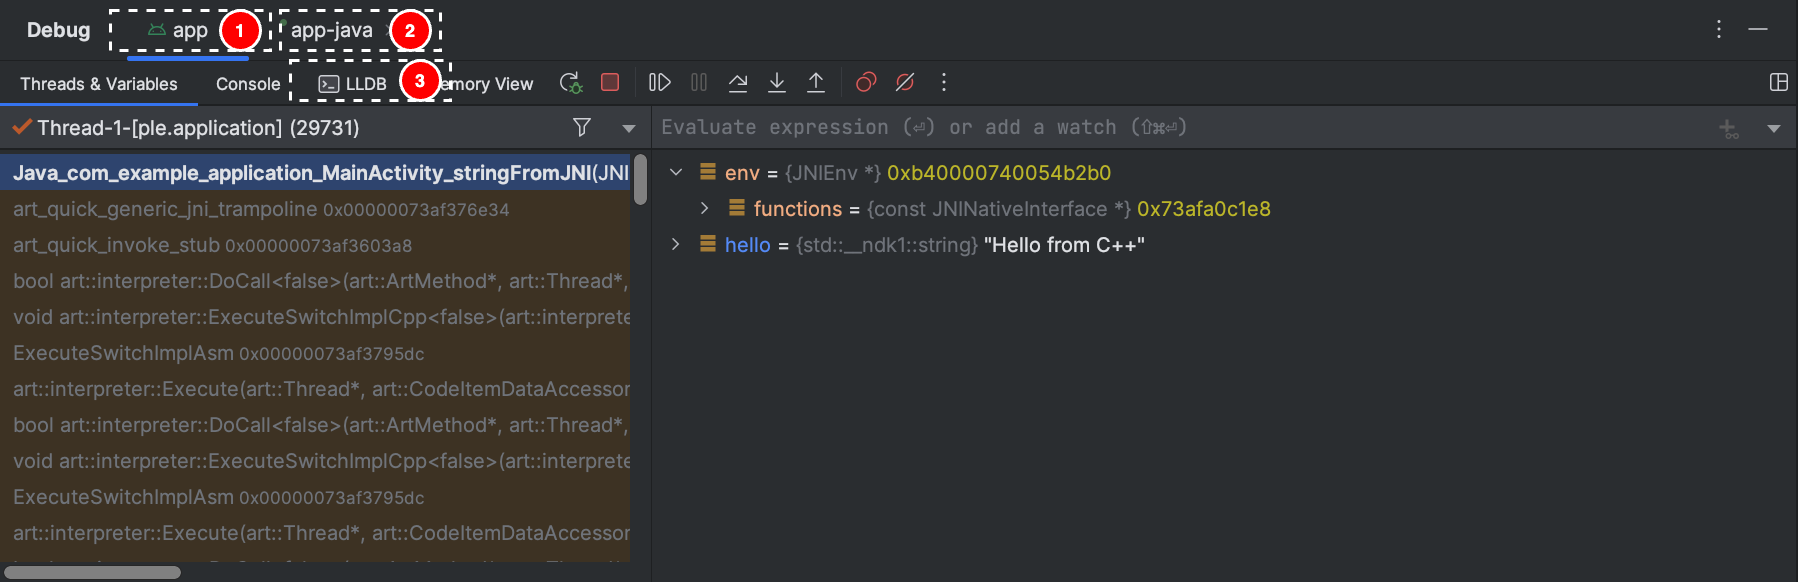
Figure 4. Debugging native code using LLDB.
- Android Studio automatically switches to the <your-module> tab when LLDB debugger encounters a breakpoint in your C/C++ code. The Frames, Variables, and Watches panes are also available and work exactly as they would if you were debugging Java code. Although the Threads pane is not available in the LLDB session view, you can access your app processes using the drop-down list in the Frames pane. You can learn more about these panes in the sections about how to Debug Window Frames and Inspect Variables.
Note: While inspecting a breakpoint in your native code, the Android system suspends the virtual machine that runs your app’s Java bytecode. This means that you are unable to interact with the Java debugger or retrieve any state information from your Java debugger session while inspecting a breakpoint in your native code.
- Android Studio automatically switches to the <your-module>-java tab when the Java debugger encounters a breakpoint in your Java code.
- While debugging with LLDB, you can use the LLDB terminal in the LLDB session view to pass command line options to LLDB. If you have certain commands that you would like LLDB to execute each time you start debugging your app, either just before or just after the debugger attaches to your app process, you can add those commands to your debug configuration.
While debugging C/C++ code, you can also set special types of breakpoints, called watchpoints, that can suspend your app process when your app interacts with a particular block of memory. To learn more, read the section about how to add watchpoints.
View and configure breakpoints
To view all the breakpoints and configure breakpoint settings, click View Breakpoints  on the left side of the Debug window. The Breakpoints window appears, as shown in figure 5.
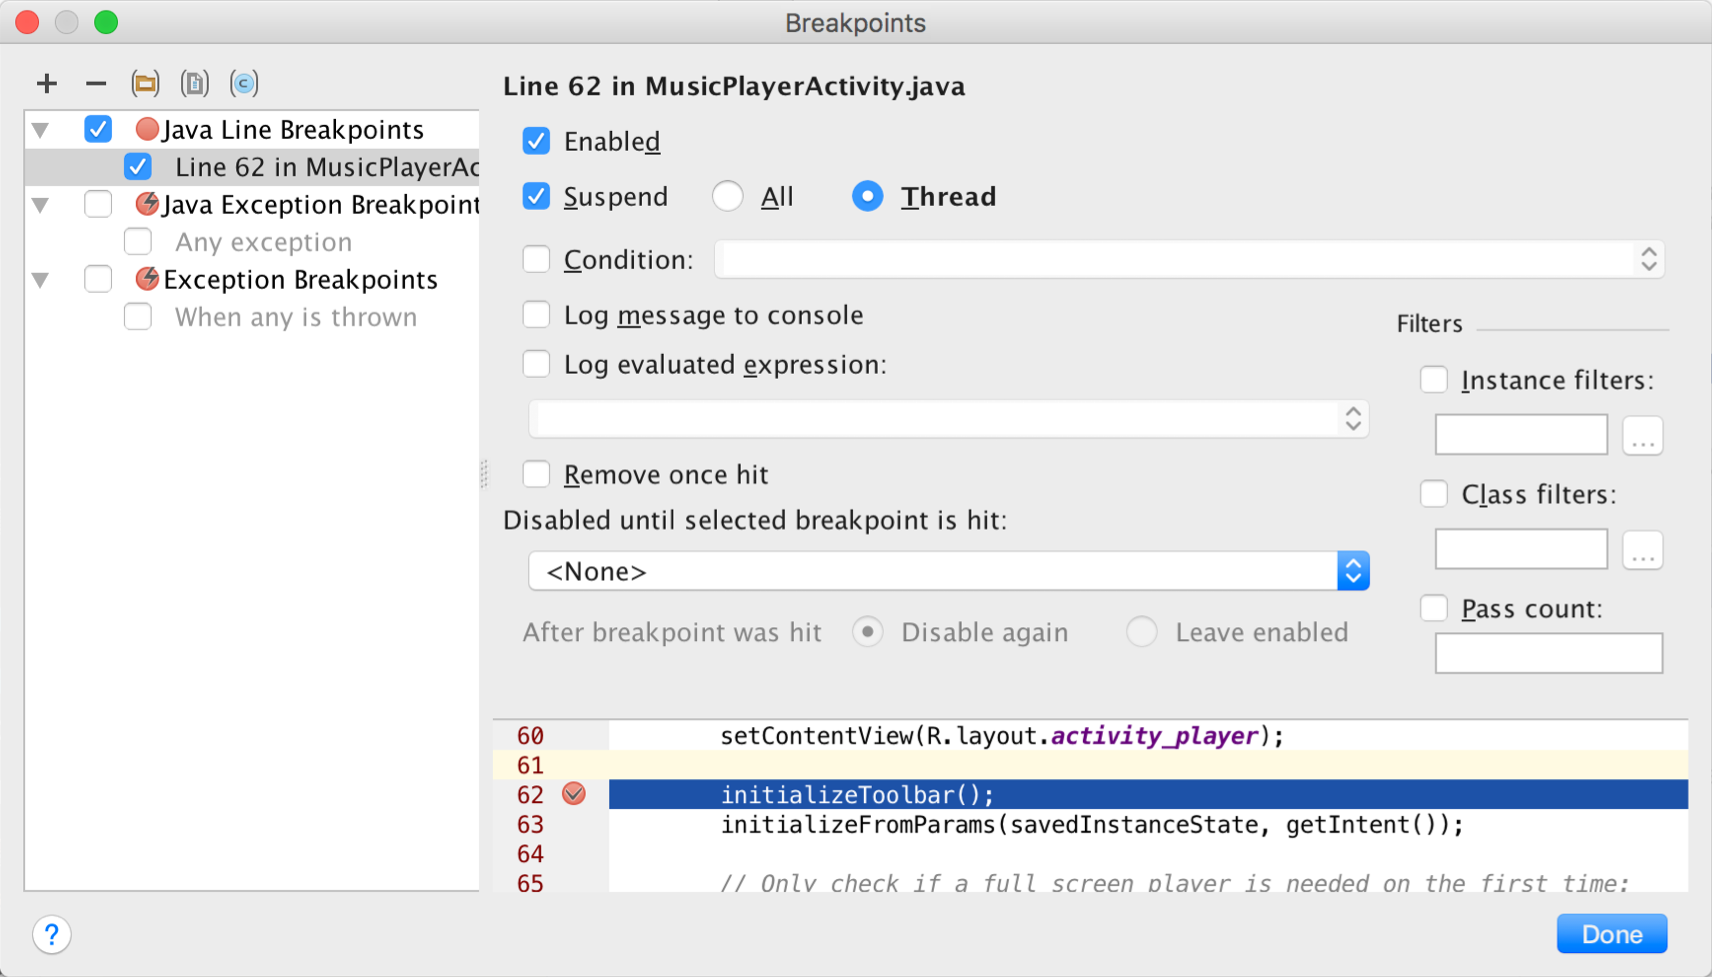
Figure 5. The Breakpoints window lists all the current breakpoints and includes behavior settings for each.
The Breakpoints window lets you enable or disable each breakpoint from the list on the left. If a breakpoint is disabled, Android Studio does not pause your app when it hits that breakpoint. Select a breakpoint from the list to configure its settings. You can configure a breakpoint to be disabled at first and have the system enable it after a different breakpoint is hit. You can also configure whether a breakpoint should be disabled after it is hit. To set a breakpoint for any exception, select Exception Breakpoints in the list of breakpoints.
Debug window frames
In the Debugger window, the Frames pane enables you to inspect the stack frame that caused the current breakpoint to be hit. This enables you to navigate and examine the stack frame and also inspect the list of threads in your Android app. To select a thread, use the thread selector drop-down and view its stack frame. Clicking on the elements in the frame opens the source in the editor. You can also customize the thread presentation and export the stack frame as discussed in the Window Frames guide.
Inspect variables
In the Debugger window, the Variables pane enables you to inspect variables when the system stops your app on a breakpoint and you select a frame from the Frames pane. The Variables pane also enables you to evaluate ad-hoc expressions using static methods and/or variables available within the selected frame.
The Watches pane provides similar functionality except that expressions added to the Watches pane persist between debugging sessions. You should add watches for variables and fields that you access frequently or that provide state that is helpful for the current debugging session. The Variables and Watches panes appear as shown in figure 5.
To add a variable or expression to the Watches list, follow these steps:
- Begin debugging.
- In the Watches pane, click Add
 .
.
- In the text box that appears, type the name of the variable or expression you want to watch and then press Enter.
To remove an item from the Watches list, select the item and then click Remove  .
.
You can reorder the elements in the Watches list by selecting an item and then clicking Up  or Down
  .
.
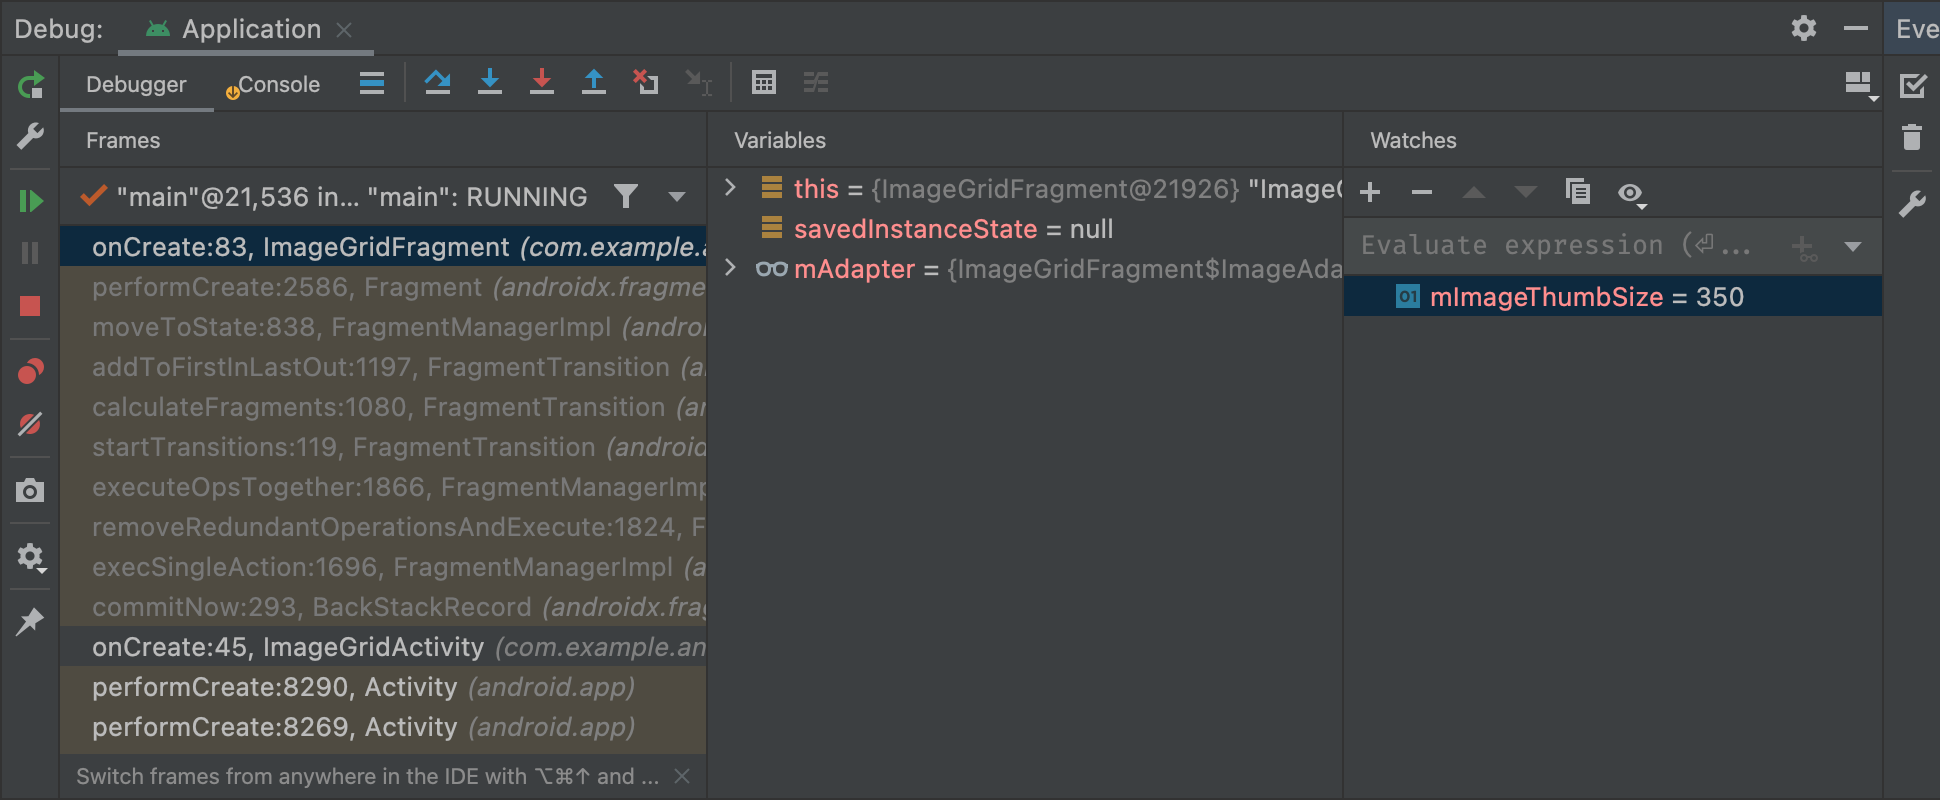
Figure 6. The Variables and Watches panes in the Debugger window.
Add watchpoints
While debugging C/C++ code, you can set special types of breakpoints, called watchpoints, that can suspend your app process when your app interacts with a particular block of memory. For example, if you set two pointers to a block of memory and assign a watchpoint to it, using either pointer to access that block of memory triggers the watchpoint.
In Android Studio, you can create a watchpoint during runtime by selecting a specific variable, but LLDB assigns the watchpoint to only the block of memory the system allocates to that variable, not the variable itself. This is different from adding a variable to the Watches pane, which enables you to observe the value of a variable but doesn’t allow you to suspend your app process when the system reads or changes its value in memory.
Note: When your app process exits a function and the system deallocates its local variables from memory, you need to reassign any watchpoints you created for those variables.
In order to set a watchpoint, you must meet the following requirements:
If you meet the requirements above, you can add a watchpoint as follows:
- While your app is suspended on a breakpoint, navigate to the Variables pane in your LLDB session view.
- Right-click on a variable that occupies the block of memory you want to track and select Add Watchpoint. A dialog to configure your watchpoint appears, as shown in figure 7.
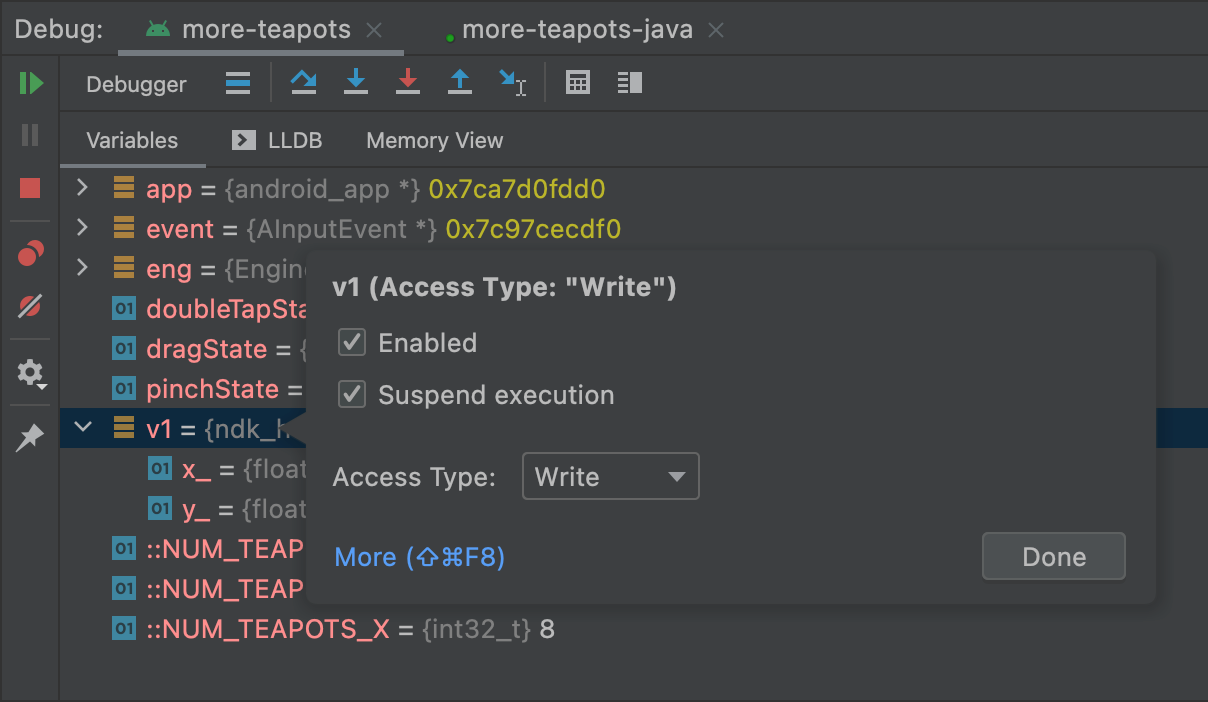
Figure 7. Adding a watchpoint to a variable in memory.
- Configure your watchpoint with the following options:
- Enabled: You can deselect this option if you want to tell Android Studio to ignore the watchpoint for the time being. Android Studio still saves your watchpoint so you can access it later in your debug session.
- Suspend: By default, the Android system suspends your app process when it accesses a block of memory you assign to a watchpoint. You can deselect this option if you don’t want this behavior—this reveals additional options you can use to customize behavior when the system interacts with your watchpoint: Log message to console and Remove [the watchpoint] when hit.
- Access Type: Select whether your app should trigger your watchpoint when it tries to Read or Write to the block of memory the system allocates to the variable. To trigger your watchpoint on either a read or write, select Any.
- Click Done.
To view all your watchpoints and configure watchpoint settings, click View Breakpoints on the left side of the Debug window. The Breakpoints dialog appears, as shown in figure 8.
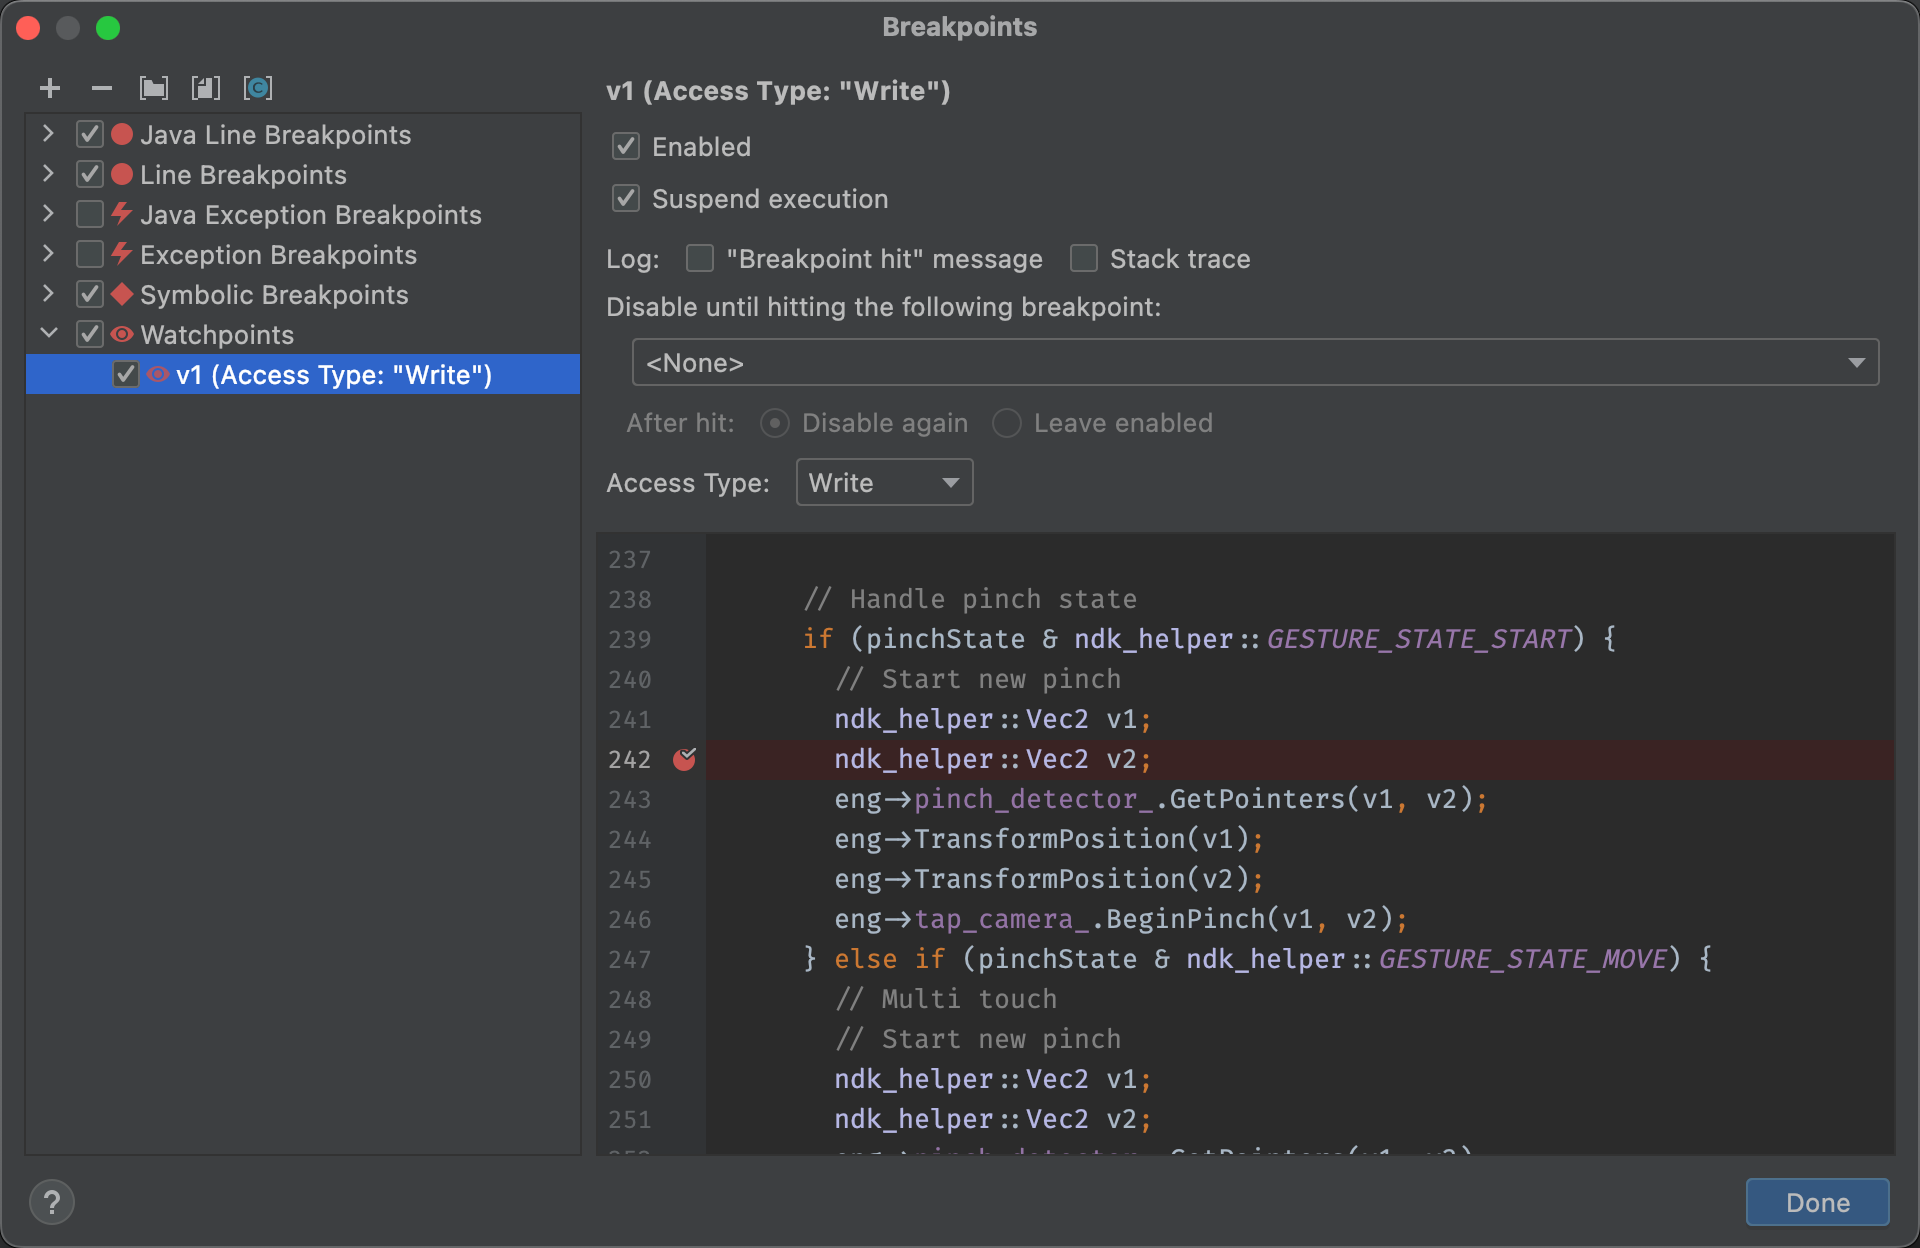
Figure 8. The Breakpoints dialogue lists your current watchpoints and includes behavior settings for each.
After you add your watchpoint, click Resume Program on the left side of the Debug window to resume your app process. By default, if your app tries to access a block of memory that you have set a watchpoint to, the Android system suspends your app process and a watchpoint icon (  ) appears next to the line of code that your app executed last, as shown in figure 9.
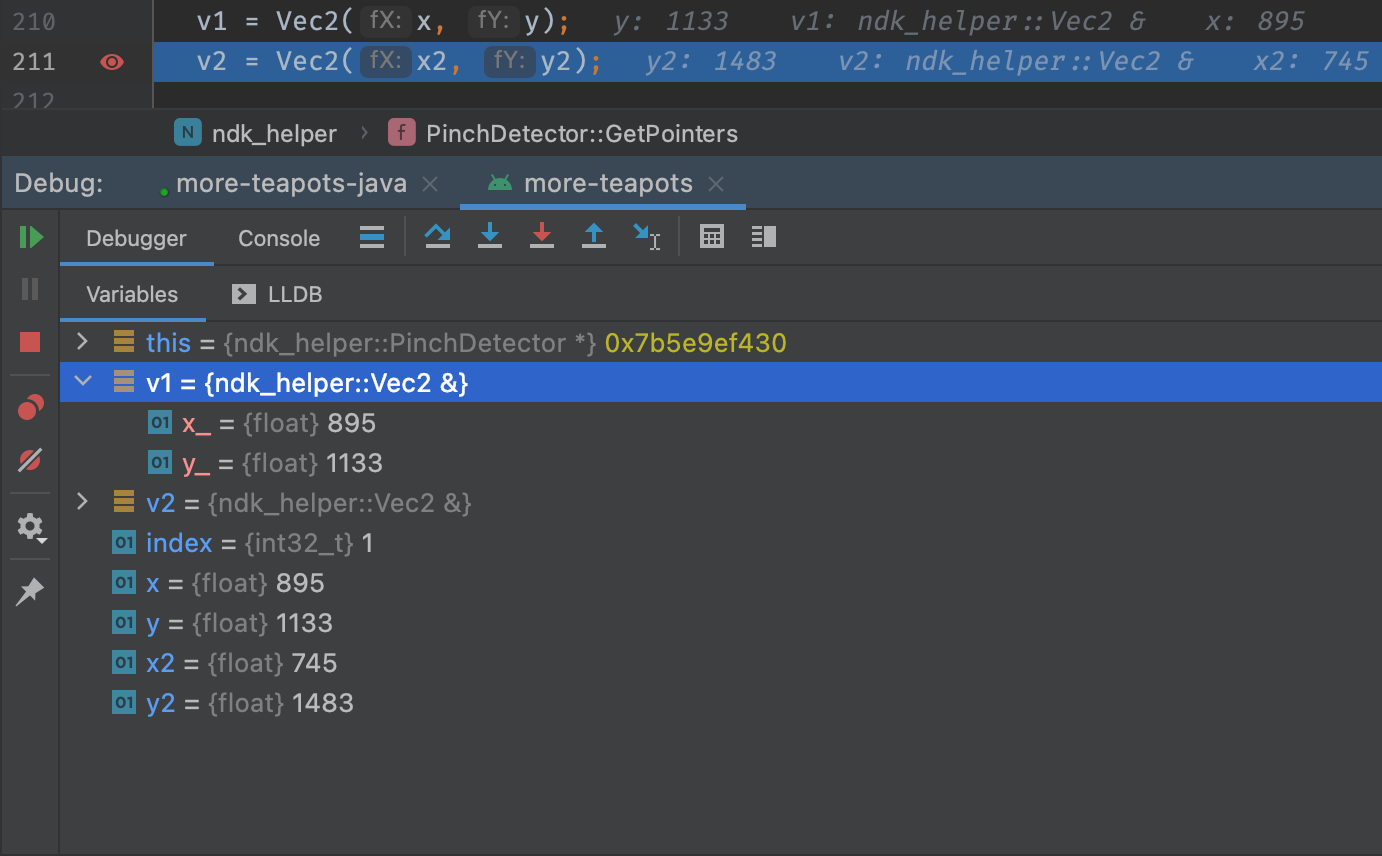
Figure 9. Android Studio indicates the line of code that your app executes just before triggering a watchpoint.
Track object allocation
Android Studio lets you track objects that are being allocated on the Java heap and see which classes and threads are allocating these objects. This enables you to see the list of objects allocated during a period of interest. This information is valuable for assessing memory usage that can affect application performance.
- Start your app as described in Run Your App in Debug Mode, and then select View > Tool Windows > Android Monitor (or click Android Monitor in the window bar).
- In the Android Monitor window, click the Monitors tab.
- At the top of the window, select your device and app process from the drop-down lists.
- In the Memory panel, click Start Allocation Tracking
 .
.
- Interact with your app on the device.
- Click the same button again to Stop Allocation Tracking.
Android Monitor displays with information about application Memory, CPU, GPU, and Network usage. See Android Monitor Basics for information about how to use Android Monitor. See also Android Monitor Overview for an introduction to Android Monitor features, which include a logging catalog (logcat), performance monitors, data analysis tools, and screen and video capture tools.
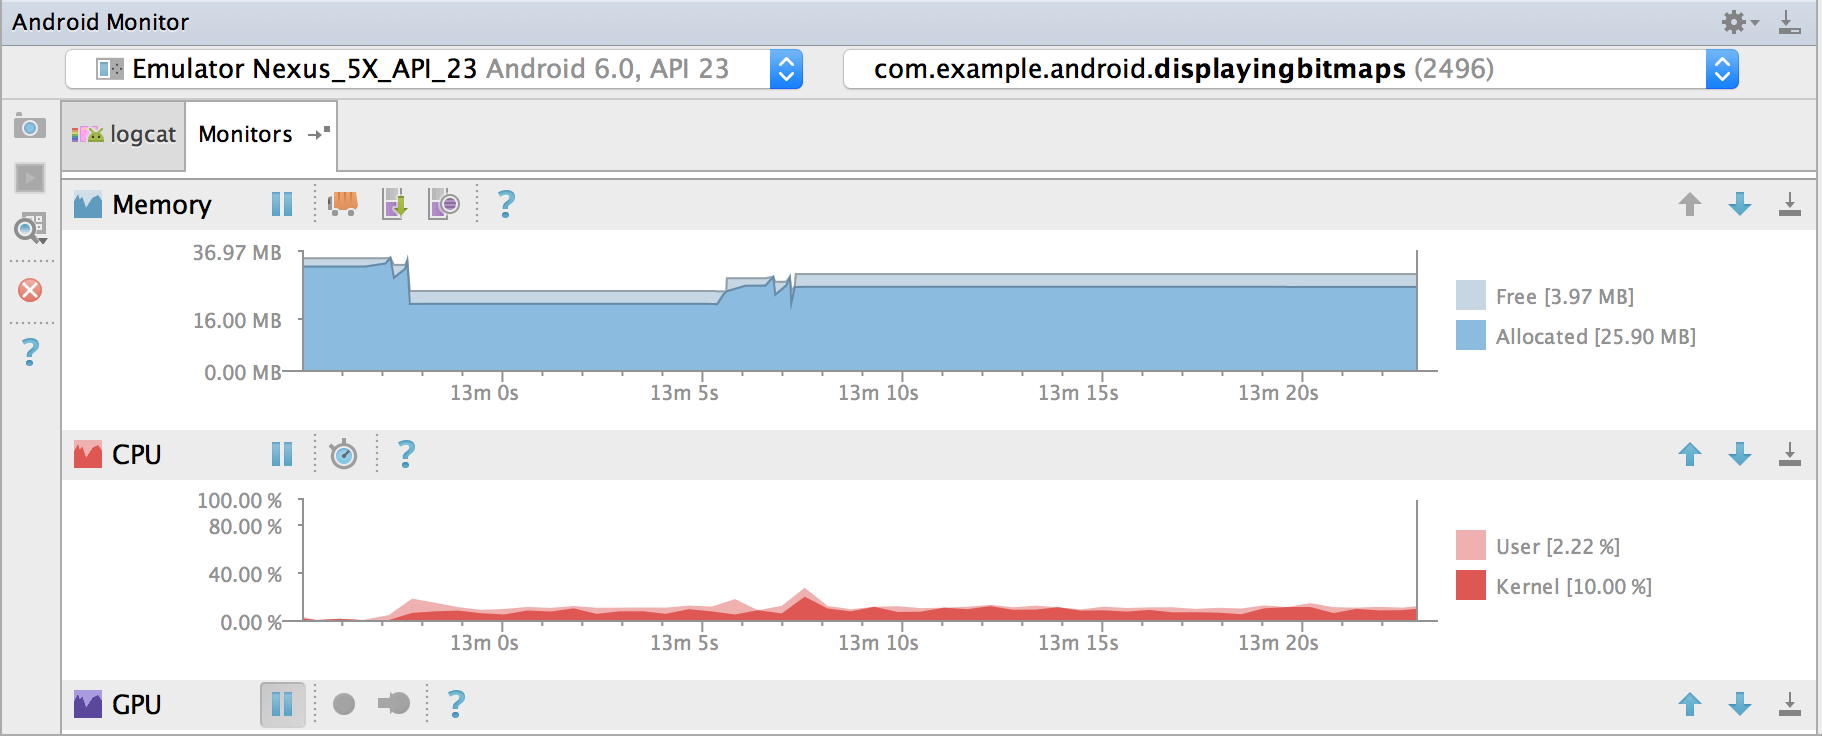
Figure 10. Object allocation tracking in Android Studio.
View and change resource value display format
In debug mode, you can view resource values and select a different display format. With the Variables tab displayed and a frame selected, do the following:
- In the Variables list, right-click anywhere on a resource line to display the drop-down list.
- In the drop-down list, select View as and select the format you want to use.The available formats depend on the data type of the resource you selected. You might see any one or more of the following options:
- Class: Display the class definition.
- toString: Display string format.
- Object: Display the object (an instance of a class) definition.
- Array: Display in an array format.
- Timestamp: Display date and time as follows: yyyy-mm-dd hh:mm:ss.
- Auto: Android Studio chooses the best format based on the data type.
- Binary: Display a binary value using zeroes and ones.
- MeasureSpec: The value passed from the parent to the selected child. See
MeasureSpec.
- Hex: Display as a hexadecimal value.
- Primitive: Display as a numeric value using a primitive data type.
- Integer: Display a numeric value of type
Integer.
You can create a custom format (data type renderer), as follows:
- Right-click the resource value.
- Select View as.
- Select Create. The Java Data Type Renderers dialog displays.
- Follow the instructions at Java Data Type Renderers.
Analyze runtime metrics to optimize your App
Even if your application does not generate runtime errors, this does not mean it is free of problems. You should also consider the following issues:
- Does your app use memory efficiently?
- Does your app generate unnecessary network traffic?
- What methods should you focus your attention on to improve the performance of your app?
- Does your app behave properly when the user receives a phone call or a message?
The Android Device Monitor is a stand-alone tool with a graphical user interface for serveral Android application debugging and analysis tools, including the Dalvik Debug Monitor Server (DDMS). You can use the Android Device Monitor to analyze memory usage, profile methods, monitor network traffic and simulate incoming calls and messages.
To open the Android Device Monitor from Android Studio, click Monitor  on the toolbar. The Android Device Monitor opens in a new window.
For more information about the Android Device Monitor and DDMS, see Device Monitor and Using DDMS.
Capture screenshots and videos
Android Studio enables you to capture a screenshot or a short video of the device screen while your app is running. Screenshots and videos are useful as promotional materials for your app, and you can also attach them to bug reports that you send to your development team.
To take a screenshot of your app:
- Start your app as described in Run your App in Debug Mode.
- Click Android Monitor .
- Click Screen Capture
 on the left.
- Optional: To add a device frame around your screenshot, click Frame screenshot.
- Click Save.
To take a video recording of your app:
- Start your app as described in Run your App in Debug Mode.
- Click Android Monitor .
- Click Screen Record
 on the left.
- Click Start Recording.
- Interact with your app.
- Click Stop Recording.
- Enter a file name for the recording and click OK.